OLEX
Olex is a uniqe system for navigation and charting, developed by the Norwegian company Olex AS. The system is used in fisheries, aquaculture, and maritime contracting, and consist of three main elements:
- Functions for seabed, water colomn and currents mapping.
- Navigation, and display of digital vector charts.
- Plotting functions
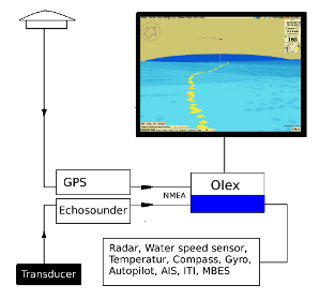
Olex calculates a sea floor map using data from GPS and echosounder. For each new measured depth, the map improves. The survey takes place automatically and requires no operation.
The sea floor map can display in 2D with contour lines or relief, and in 3D with a virtual camera which can be used to look around the seafloor. Bottom zoom is used to highlight selected depht areas. In addition comes special functions like calculation of water and bottom mass volume, and tools for searching and removal of bad measurings.

Olex is designed for optimal use with easy operation:
- Effordless vector chart handling
- Fast and smooth zooming and chart rotation
- Easy route planning and editing
- Tracking and naming of radar targets
- Autopilot interface with clear information
- Depths and elevations in meters, fathoms or feet
- Highlights previous echosoundings for help in navigation
- Automatic tide correction
- Animated lights and sectors
- All trips stored for future reuse
- Stepless dimming, and night screen
- Multiple languages available
Software updates from Olex are free of charge.
Technical details
The system works under UNIX, for the time being Linux. All software is manufactured by Olex AS, except the tide calculations which are handled by XTide2 The system continuously upgrades its own world map. The measured data are always ready for use.
The system runs with electronic vectorized charts. Effective use of digital charts requires fast computer processing. The chart cells are converted into an internal compact format, where they are kept in different crude scaling levels. To achieve this, the coastline and other details have to be recalculated and reduced. In this way the time and memory requirement of the visualization program are kept at a fairly limited and constant level at any zoom scale. The screen will not be filled up with unnecessary information. In the crude scaling level, the visualization program scales the charts in several steps. In this way a fine and seamless interactive scaling is achieved, without any annoying details related to the organisation of the cells.
By continuously recording depth and position the system builds a database where the sea floor is divided into squares of any resolution. The default resolution is 5X5 meter, an adjustment of today's GPS equipment, but the user can easlily create new sea floor databases in any resolution down to a few cm. The squares may be considered as a grid covering the surface of the hole earth. They contain a depth value which are either measured, calculated or unknown. New measurements will result in a recalculation of the unmeasured squares in some radius from the considered point.